Insights
January 03, 2020
A remarkable decade draws to a close as the global economy still deals with the aftermath of the financial crisis. The decade delivered outstanding investment performance and 10 years later we are still coping with the economic and investment implications of one of the greatest financial disasters in history.
The United States surpassed its old record of 120 consecutive months of economic expansion in June of this year. That’s 10 consecutive years with no recession, and we are on the verge of making it to 126 months as 2019 draws to a close. Before we get too full of ourselves, it is important to point out that this is not even close to the all-time record. Australia holds that distinction with 28 consecutive years of economic expansion without a recession - a streak that continues for them into the final quarter of 2019. Still another reason not to get too uppity is despite its longevity, this has been one of the shallowest economic recoveries in history and has important ramifications for the economy, capital markets, and geopolitics going forward.
Economic expansions and cumulative GDP
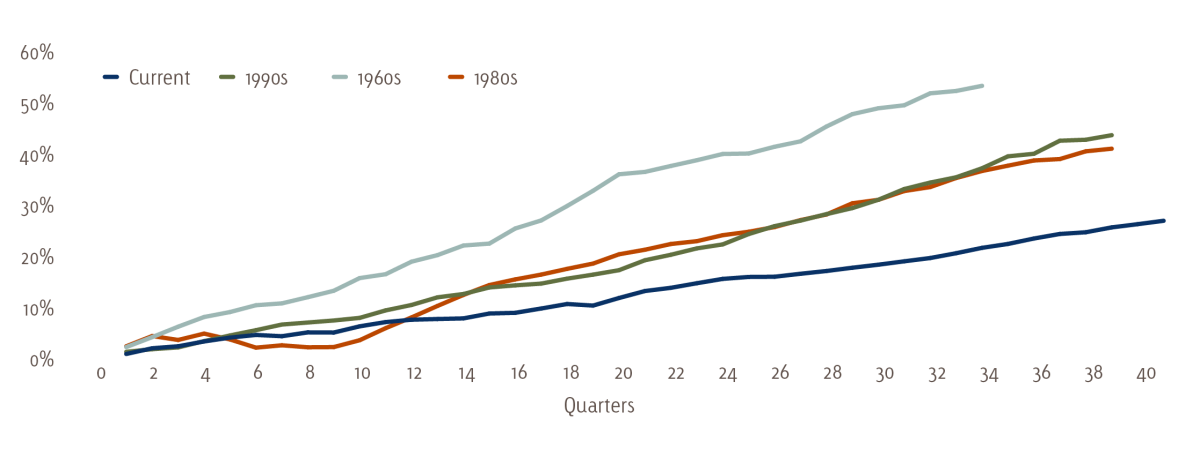
Source: Bureau of Economic Analysis, Bloomberg
Understanding these crosscurrents is crucial to forecasting the future. This recession was a balance sheet recession, and these take time to resolve as consumers and financial institutions need to restructure and repair, as well as change their destructive and unhealthy habits. As we sit here on the eve of 2020, the U.S. consumer’s transformation into a financially responsible adult is complete and key to the economy moving forward. Additionally, the U.S. banking system has been re-capitalized and nursed back to health. This transformation, however, comes with more regulatory oversight and greater capital requirements. While designed to prevent future financial accidents, these tough new regulations may limit the funding needed for business formation and economic growth. They also may limit growth prospects for the banking sector moving forward.
It might be easy to say domestic equities are set to take a breather in 2020, given the S&P 500’s 28% year to date return (through December 13) against a very bleak earnings backdrop.
S&P 500® earnings growth
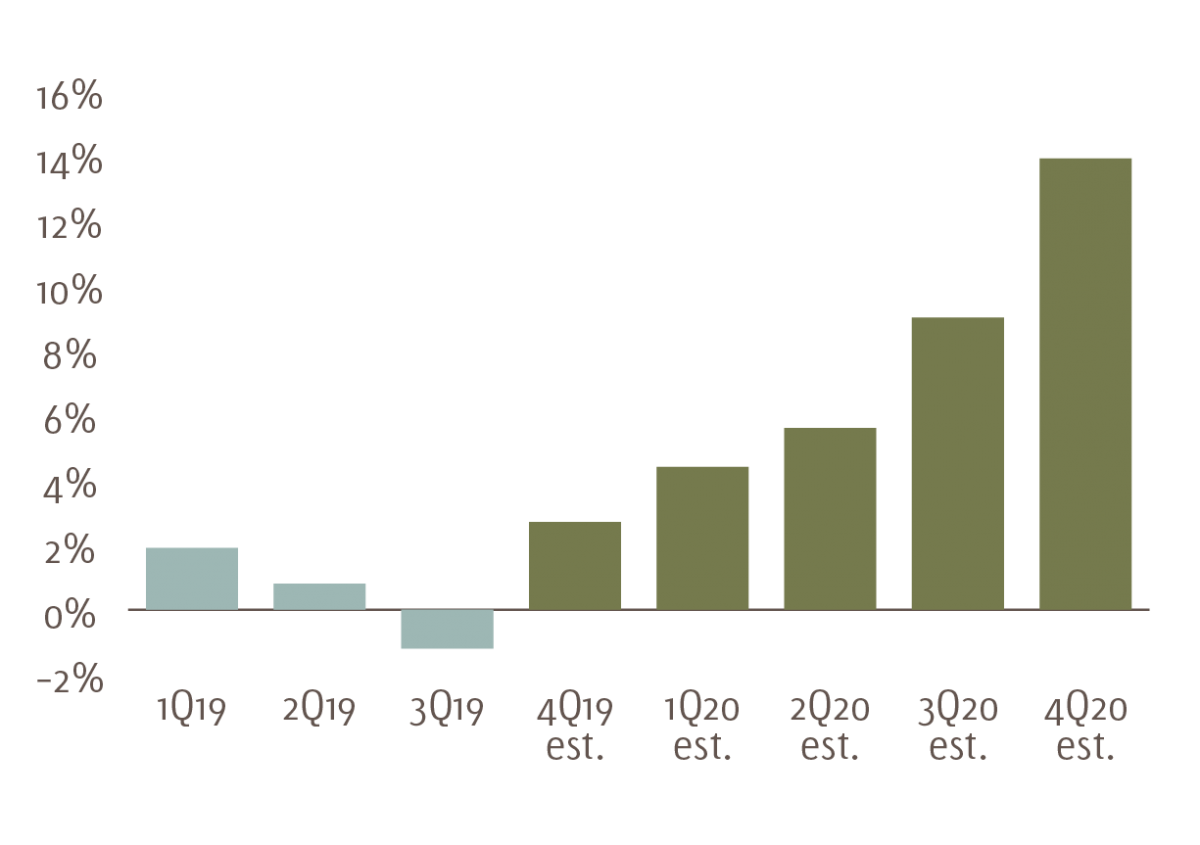
Source: S&P 500®, Bloomberg
Corporate earnings did however surprise to the upside, and the earnings recession expected by investors never materialized. It is also important to keep in mind that we started the year with an extremely depressed P/E multiple, so multiple expansion was indeed warranted. As the markets spent much of 2019 climbing the wall of worry that was a Federal Reserve seen as too tight, a trade war, a potential earnings recession, and a potential economic recession, it was the U.S. consumer who carried the year. The U.S. consumer’s importance to the world economy cannot be understated:
Share of world GDP (2018)
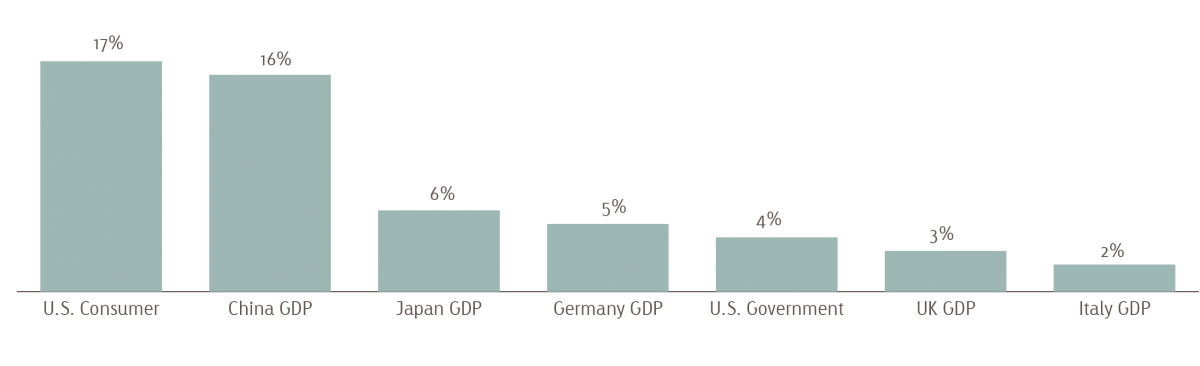
Source: CJ Lawrence, Strategas
Armed with a healthy balance sheet and a new disciplined savings rate, the U.S. consumer will continue to be the workhorse into 2020.
Household debt as % of GDP
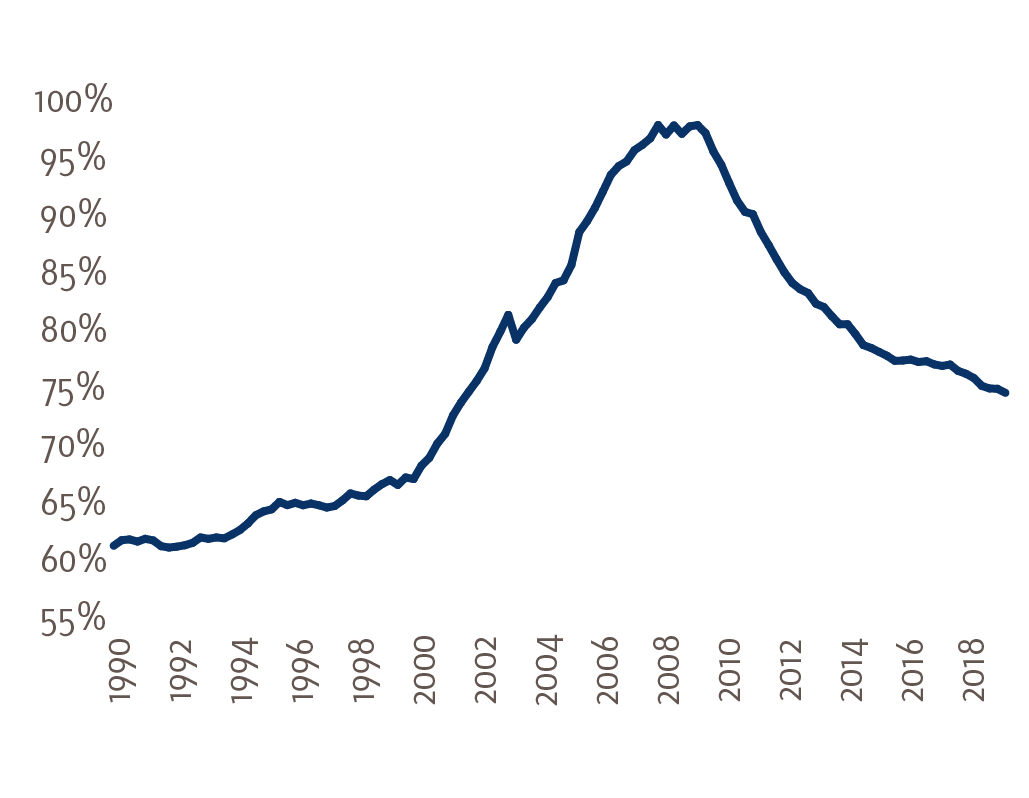
Source: Bloomberg
U.S. personal savings rate
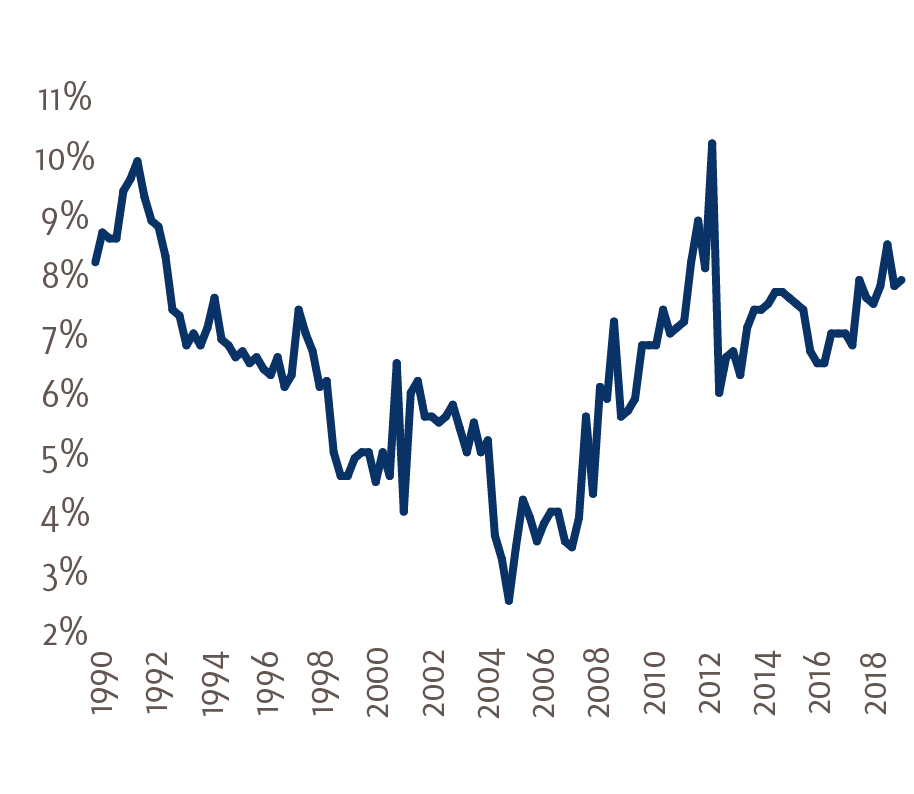
Source: Bloomberg
With an accommodative central bank, easy financial conditions, fair P/E multiples, and corporate earnings moving in the right direction, U.S. equities should outperform fixed income in 2020.
Goldman Sachs U.S. Financial Conditions Index
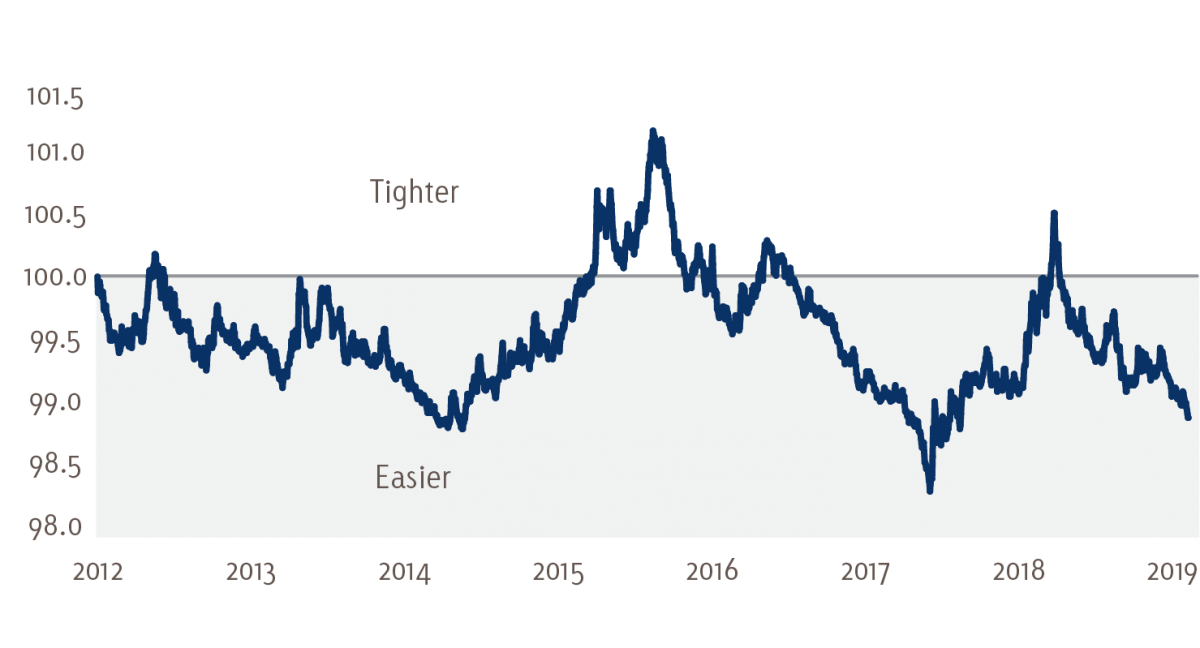
Source: Goldman Sachs, Bloomberg
Looking at the rest of the world, it should come as little surprise that Europe suffered immensely in 2019 due to its dependence on trade:
Exports as a % of GDP
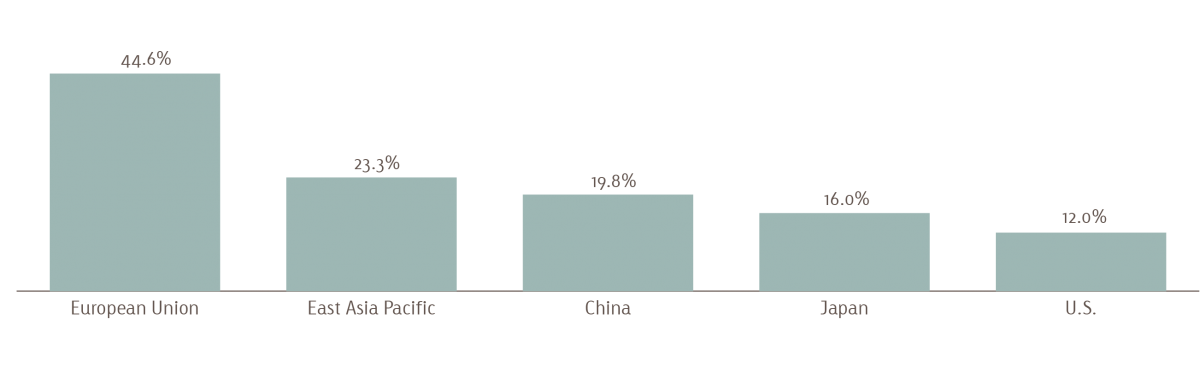
Source: World Bank, 2017 data; except U.S. and Japan 2016
The slowdown in global trade due to the U.S. / China trade conflict impacted Europe the most as Germany narrowly averted a recession. With the U.S. threatening a 10% tariff on German automobiles and an uncertain Brexit outcome, it is no wonder there was so much doom and gloom around Europe. Yet another contributing factor to the slowdown were the strict new European emissions standards slated to take effect on January 1, 2020. The aggressive approach taken by European regulators caused a slowdown in production and serves as a reminder that going green does come with an economic cost in the short term.
As we enter 2020, China and the U.S. have agreed on a Phase 1 trade deal. Brexit is on more solid footing with the conservative party victory giving Boris Johnson a mandate to negotiate a soft Brexit. Economic activity in Europe has troughed and these tailwinds should now lift their growth prospects. Additionally, the European economic surprise index has been moving upward. Following a mid-cycle slowdown, industrials globally should be poised to rise. This benefits international developed markets relative to US stocks. It should also benefit value stocks relative to growth stocks, especially given the relative valuation between the two. Ultimately we believe this trade truce and global reflation will benefit emerging market equities.
Russell 3000® Value NTM P/E Relative Russell 3000® Growth NTM P/E
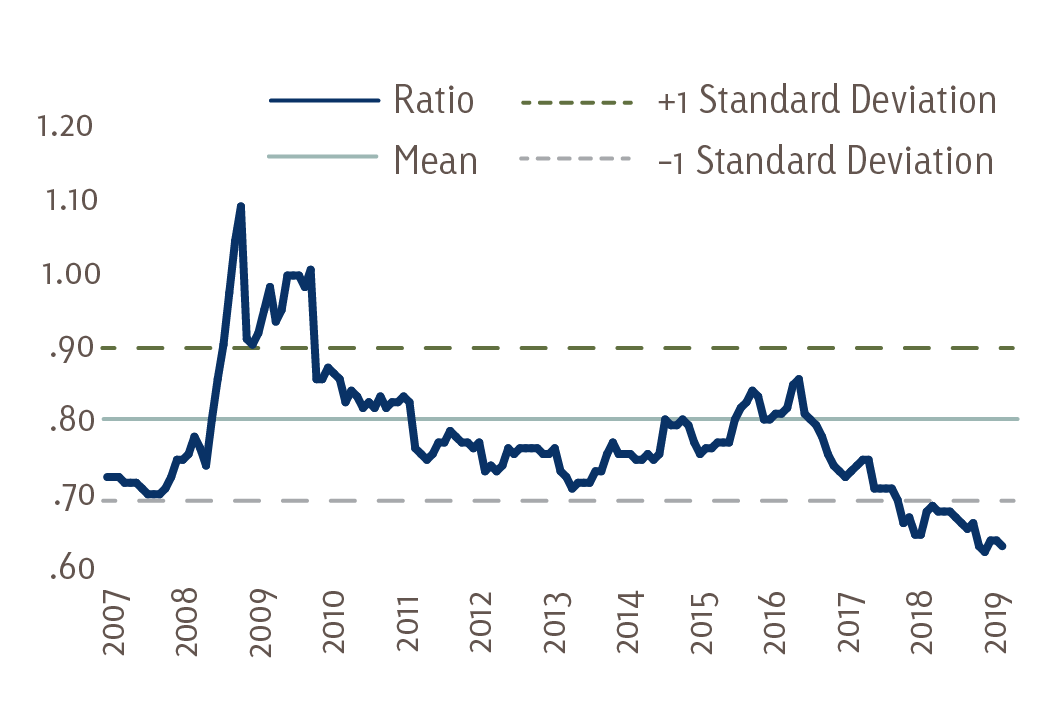
Source: Bloomberg
Dollar as lynchpin for 2020
Up until last year, the U.S. Dollar (USD) was the beneficiary of multiple tail winds. This was partially due to interest rate differentials as the Fed was the only central bank engaged in tightening. It also benefitted from repatriation of foreign earnings to the U.S. due to the Tax Cuts and Jobs Act. Additionally, the USD (along with Japanese Yen) was the beneficiary of global uncertainty due to Brexit and the trade war as investors looked to safe havens. The analytics also support the fact that the USD is nearly 20% overvalued on a real effective exchange rate basis.
USD real effective exchange rate
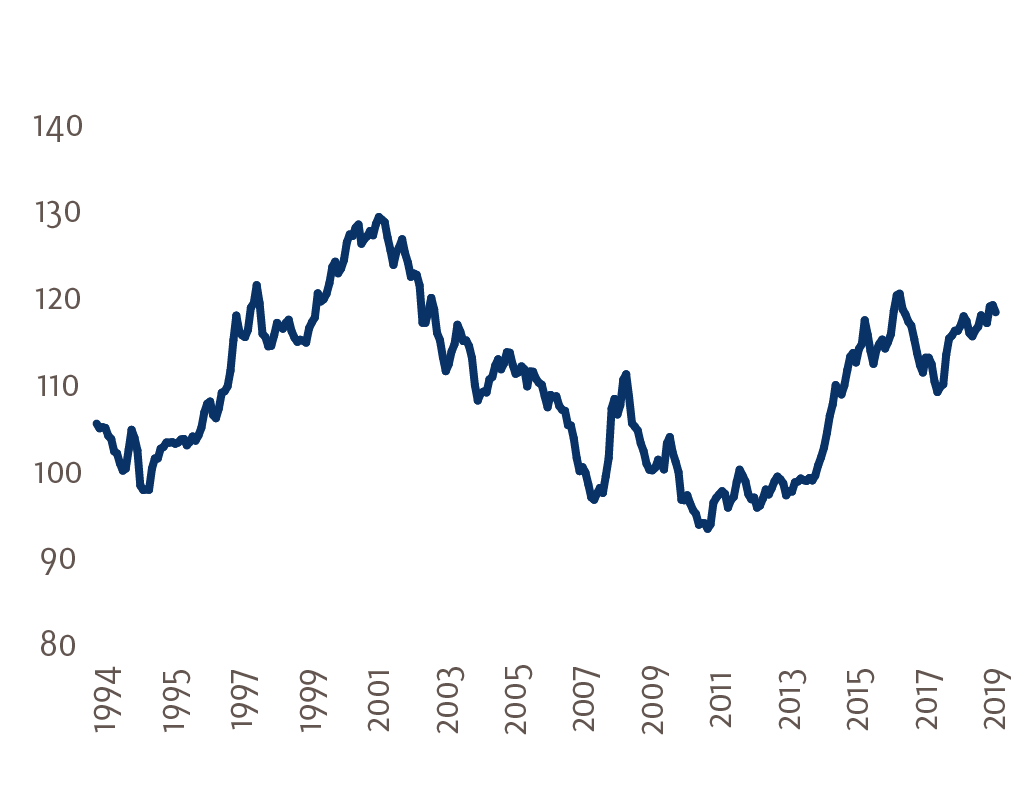
Source: Bloomberg
The tide has now shifted, and the interest rate differentials are not as great with the Fed having eased by 75 basis points in 2019. The repatriation of foreign earnings back to the U.S. has pretty much run its course. Finally, the agreement on a Phase 1 trade deal with China and a soft Brexit looking more certain, investors should look to move out of the haven USD and into other assets globally.
Surprisingly, a weaker USD could push U.S. Treasury yields higher due to the currency hedging dynamics impacting foreign U.S. Treasury holders. Negative bond yields in Japan and Europe have pushed local investors to search for income globally. The extreme cost of hedging dollar exposure back to either Yen or Euros, however, takes away any yield advantage to the foreign investor as shown by the table below.
10-Year Government Bond Yields
| as of 12/13/19 | |
|---|---|
| USTs in USD | 1.82% |
| Bund yield in EUR | -0.29% |
| JGB yield in JPY | -0.03% |
| UST hedged back to EUR | -0.64% |
| UST hedged back to JPY | -0.46% |
As a result, many Japanese and European investors are holding U.S. Treasuries unhedged. If the dollar appreciates or holds steady relative to their local currency, foreign investors will win on their unhedged gamble. However, if the dollar depreciates, the foreign investor will lose. A depreciating USD could therefore be a catalyst for European and Japanese selling US Treasuries, putting upward pressure on yields.
Since so much trade world-wide is transacted in USD, a weaker USD would ease global financial conditions which would in turn spur global reflation. Moving from a 2019 environment where the flat U.S. yield curve was pricing in the probability of a recession, and into a global reflationary environment should cause the U.S. yield curve to steepen.
China
Over the last two years, plenty has been written about the trade war and its potential impact on both the real economy and the capital markets. Many forecasters failed to see that Europe, with its export driven economy (see previous chart), was poised to be one of the losers in this protracted trade dispute. There was also a failure to recognize the relative unimportance of U.S. exports, at 12% of GDP, to its economy. Furthermore, we find that only 6.75% of U.S. exports go to China – that’s a little over 0.5% of the U.S. economy being exported to China. It also seemed to go unnoticed that despite all the dysfunction in Washington D.C., the China trade issue was one on which both democrats and republicans agreed.
An analysis of this issue from the Chinese perspective can give us some clues as to how this dispute will play out. There is no question that China is an economic powerhouse. In fact, its growth in the aftermath of the Great Financial Crisis helped Australia keep its economic expansion streak alive.
China real GDP growth rate
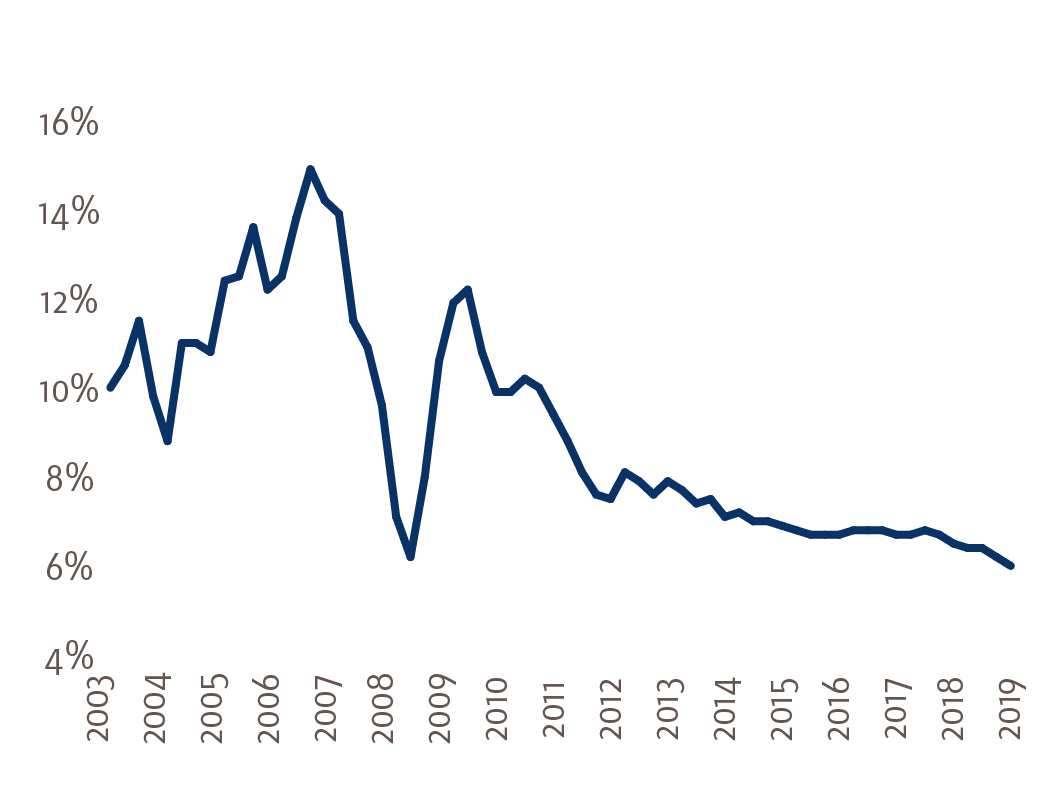
Source: Bloomberg
China total debt as % of GDP
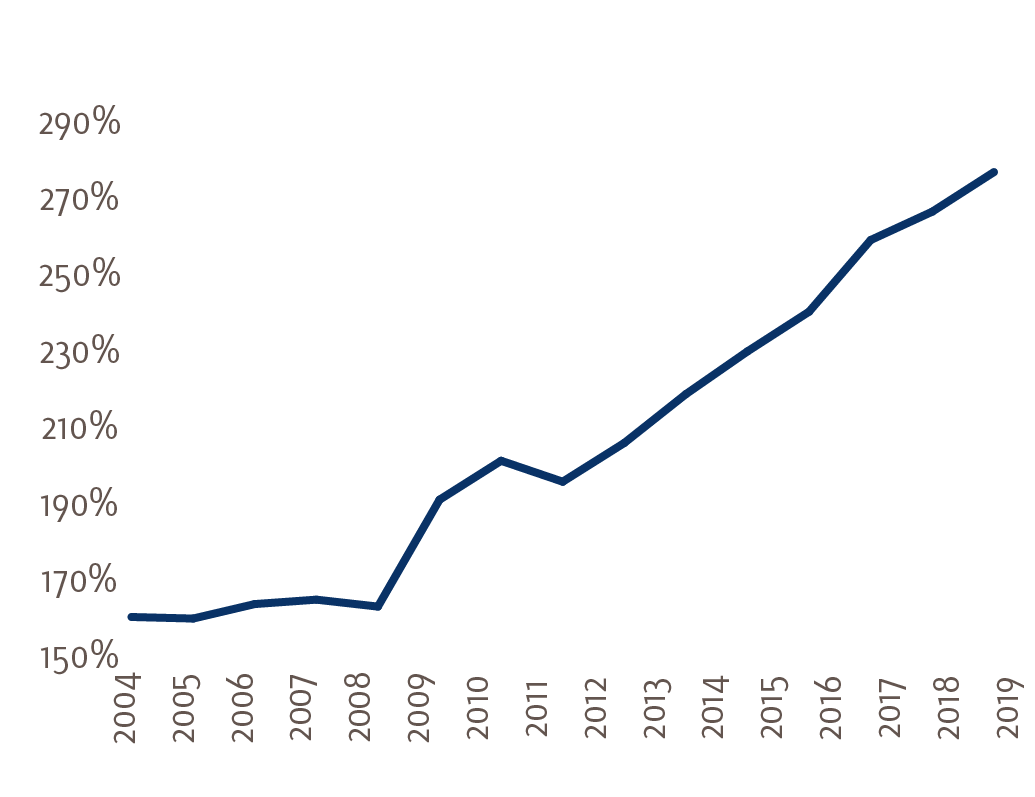
Source: Bloomberg Economics
This growth, however, has been fueled by debt and is unsustainable as they rapidly approach 300% debt to GDP.
To service this mountain of debt, China’s economy must continue to grow rapidly and anything less than 6% for an extended period could result in fiscal difficulties. Further exacerbating this issue is China’s demographics problem, the seeds of which were sewn decades ago with their one child policy. This policy has set China on a path to be one of the fastest aging countries.
Percentage of population 65 and older
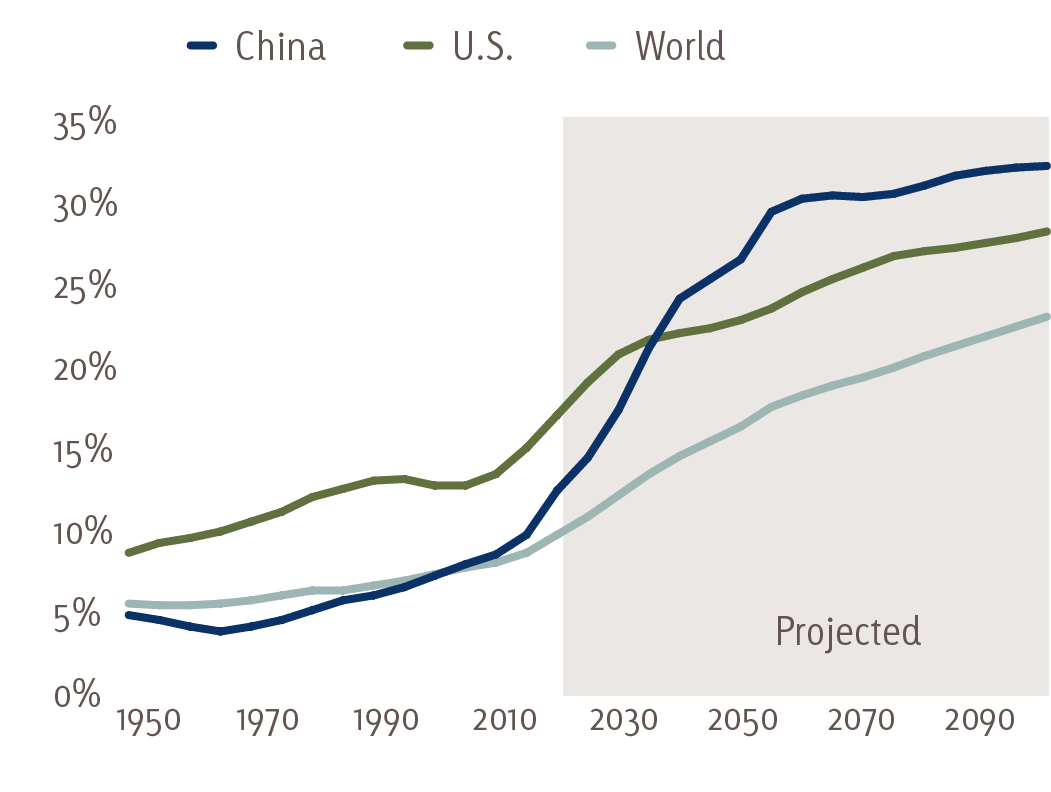
Source: United Nations Population Division, Wall Street Journal
In 1970, China’s median population age was 10 years younger than that of the U.S., however by 2015 it was older. These demographic headwinds will make it increasingly difficult to achieve the growth rate necessary to keep up with their already bloated fiscal obligations and future social needs of an aging society. This is why China is aggressively pursuing “Made in China 2025” and “Belt and Road”. Those strategies would export China’s excess capacity to the rest of the world in pursuit of the robust economic growth necessary to provide for its people. China’s plan is dependent on the free flow of goods and services globally, which is dependent on fair trade practices. Unless China reforms their practices, their economic growth will not be achieved. This is to say that China has way more to lose than the United States in the trade dispute. With a Phase 1 deal having been agreed to, it remains to be seen whether more aggressive trade reforms will be put into place. Some pundits believe China will wait until a new presidential administration is in office to negotiate a Phase 2 deal more to their liking. Given the bi-partisan support for dealing with China aggressively on this issue, we believe a Phase 2 deal could be difficult to negotiate. As a result, this trade dispute will continue for years, becoming this generation’s cold war.
Conclusions and considerations
Lots of uncertainty was priced into the capital markets during 2019 and these risks are slowly being taken away. This should lead to the following investment themes to take shape in 2020:
- U.S. domestic equities to outperform fixed income
- U.S. Treasury yields to move marginally higher with a steeper yield curve
- Start moving into International developed market equities as global reflation could benefit them relative to the U.S.
- Corporate earnings will rebound
- U.S. dollar will weaken
- Fed on hold in election year barring financial catastrophe
- Central bankers have got your back and will hold it together – for the time being
- Liquidity is your friend
- Never trust the results of a political poll – especially important as we move into 2020
- The U.S. consumer is King
- Trade war is not over, but storm clouds are dissipating
Red Cedar Investment Management, LLC (Red Cedar) is an investment adviser registered under the Investment Advisers Act of 1940. Registration as an investment adviser does not imply any level of skill or training. The information presented in the material is general in nature and is not designed to address your investment objectives, financial situation or particular needs. Prior to making any investment decision, you should assess, or seek advice from a professional regarding whether any particular transaction is relevant or appropriate to your individual circumstances. Although taken from reliable sources, Red Cedar cannot guarantee the accuracy of the information received from third parties.
The mention of specific securities and sectors illustrates the application of our investment approach only and is not to be considered a recommendation by Red Cedar. The specific securities and sectors identified and described above do not represent all of the securities purchased and sold by Red Cedar, and it should not be assumed that investment in these securities or sectors were or will be profitable. Charts, diagrams and graphs, by themselves, cannot be used to make investment decisions.
The opinions expressed herein are those of Red Cedar and may not actually come to pass. This information is current as of the date of this material and is subject to change at any time, based on market and other conditions. Index performance used throughout is intended to illustrate historical market trends and performance. An index is a portfolio of specific securities, the performance of which is often used as a benchmark in judging the relative performance of certain asset classes. Indexes are unmanaged portfolios and investors cannot invest directly in an index. An index does not charge management fees or brokerage expenses, and no such fees or expenses were deducted from the performance shown.
S&P 500 is a stock market index that tracks the stocks of 500 large-cap U.S. companies. It represents the stock market’s performance by reporting the risks and returns of the biggest companies.
Russell 3000 Value Index is a market-capitalization weighted equity index maintained by the Russell Investment Group and based on the Russell 3000 Index, which measures how U.S. stocks in the equity value segment perform.